KPI Dashboard
About the project:
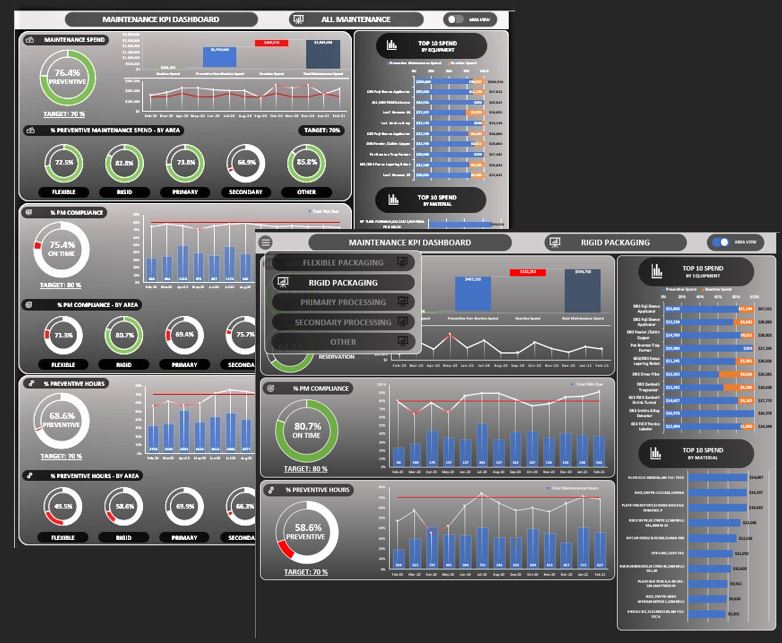
Developed a KPI dashboard for a maintenance department. Used Excel's Power Query and Power Pivot Data Model to relate and combine many reports into presentable and actionable information.
VBA was used to make the dashboard interactive. The user is able to switch between overall and focused views. Opening a menu allows switching between focus areas.
There is a companion workbook, built on top of the same Data Model, that allows easy investigation into the data to the most detailed level.
Learning these tools was a combination of many YouTube videos and some Excel courses on sites like edX.org.
Technology used:
Excel, VBA, Power Query, Power Pivot Data Model